


We analysed a million work travel bookings to answer the big questions every travel manager wants to know. Should you have a country-specific travel policy or is a regional one ok? Is it best to prioritise hotel partnerships over airlines? And exactly when is the best time to book your work trip to ensure you get a good price?
Our data helps to bust some myths about work travel bookings while helping you to improve your travel programme and make the most out of your budgets. Keep reading and you will get some valuable insights.
1. Where you travel from should shape your travel budget
Pull the bookings that make up a return trip — so a flight or a train plus a hotel stay, sometimes a car — and group them by where the traveller started out: The spread in cost of a trip is bigger than you would think. Distance, local market pricing, and flight versus rail mix all vary significantly by country.
Average cost of work trip by country of origin/departure
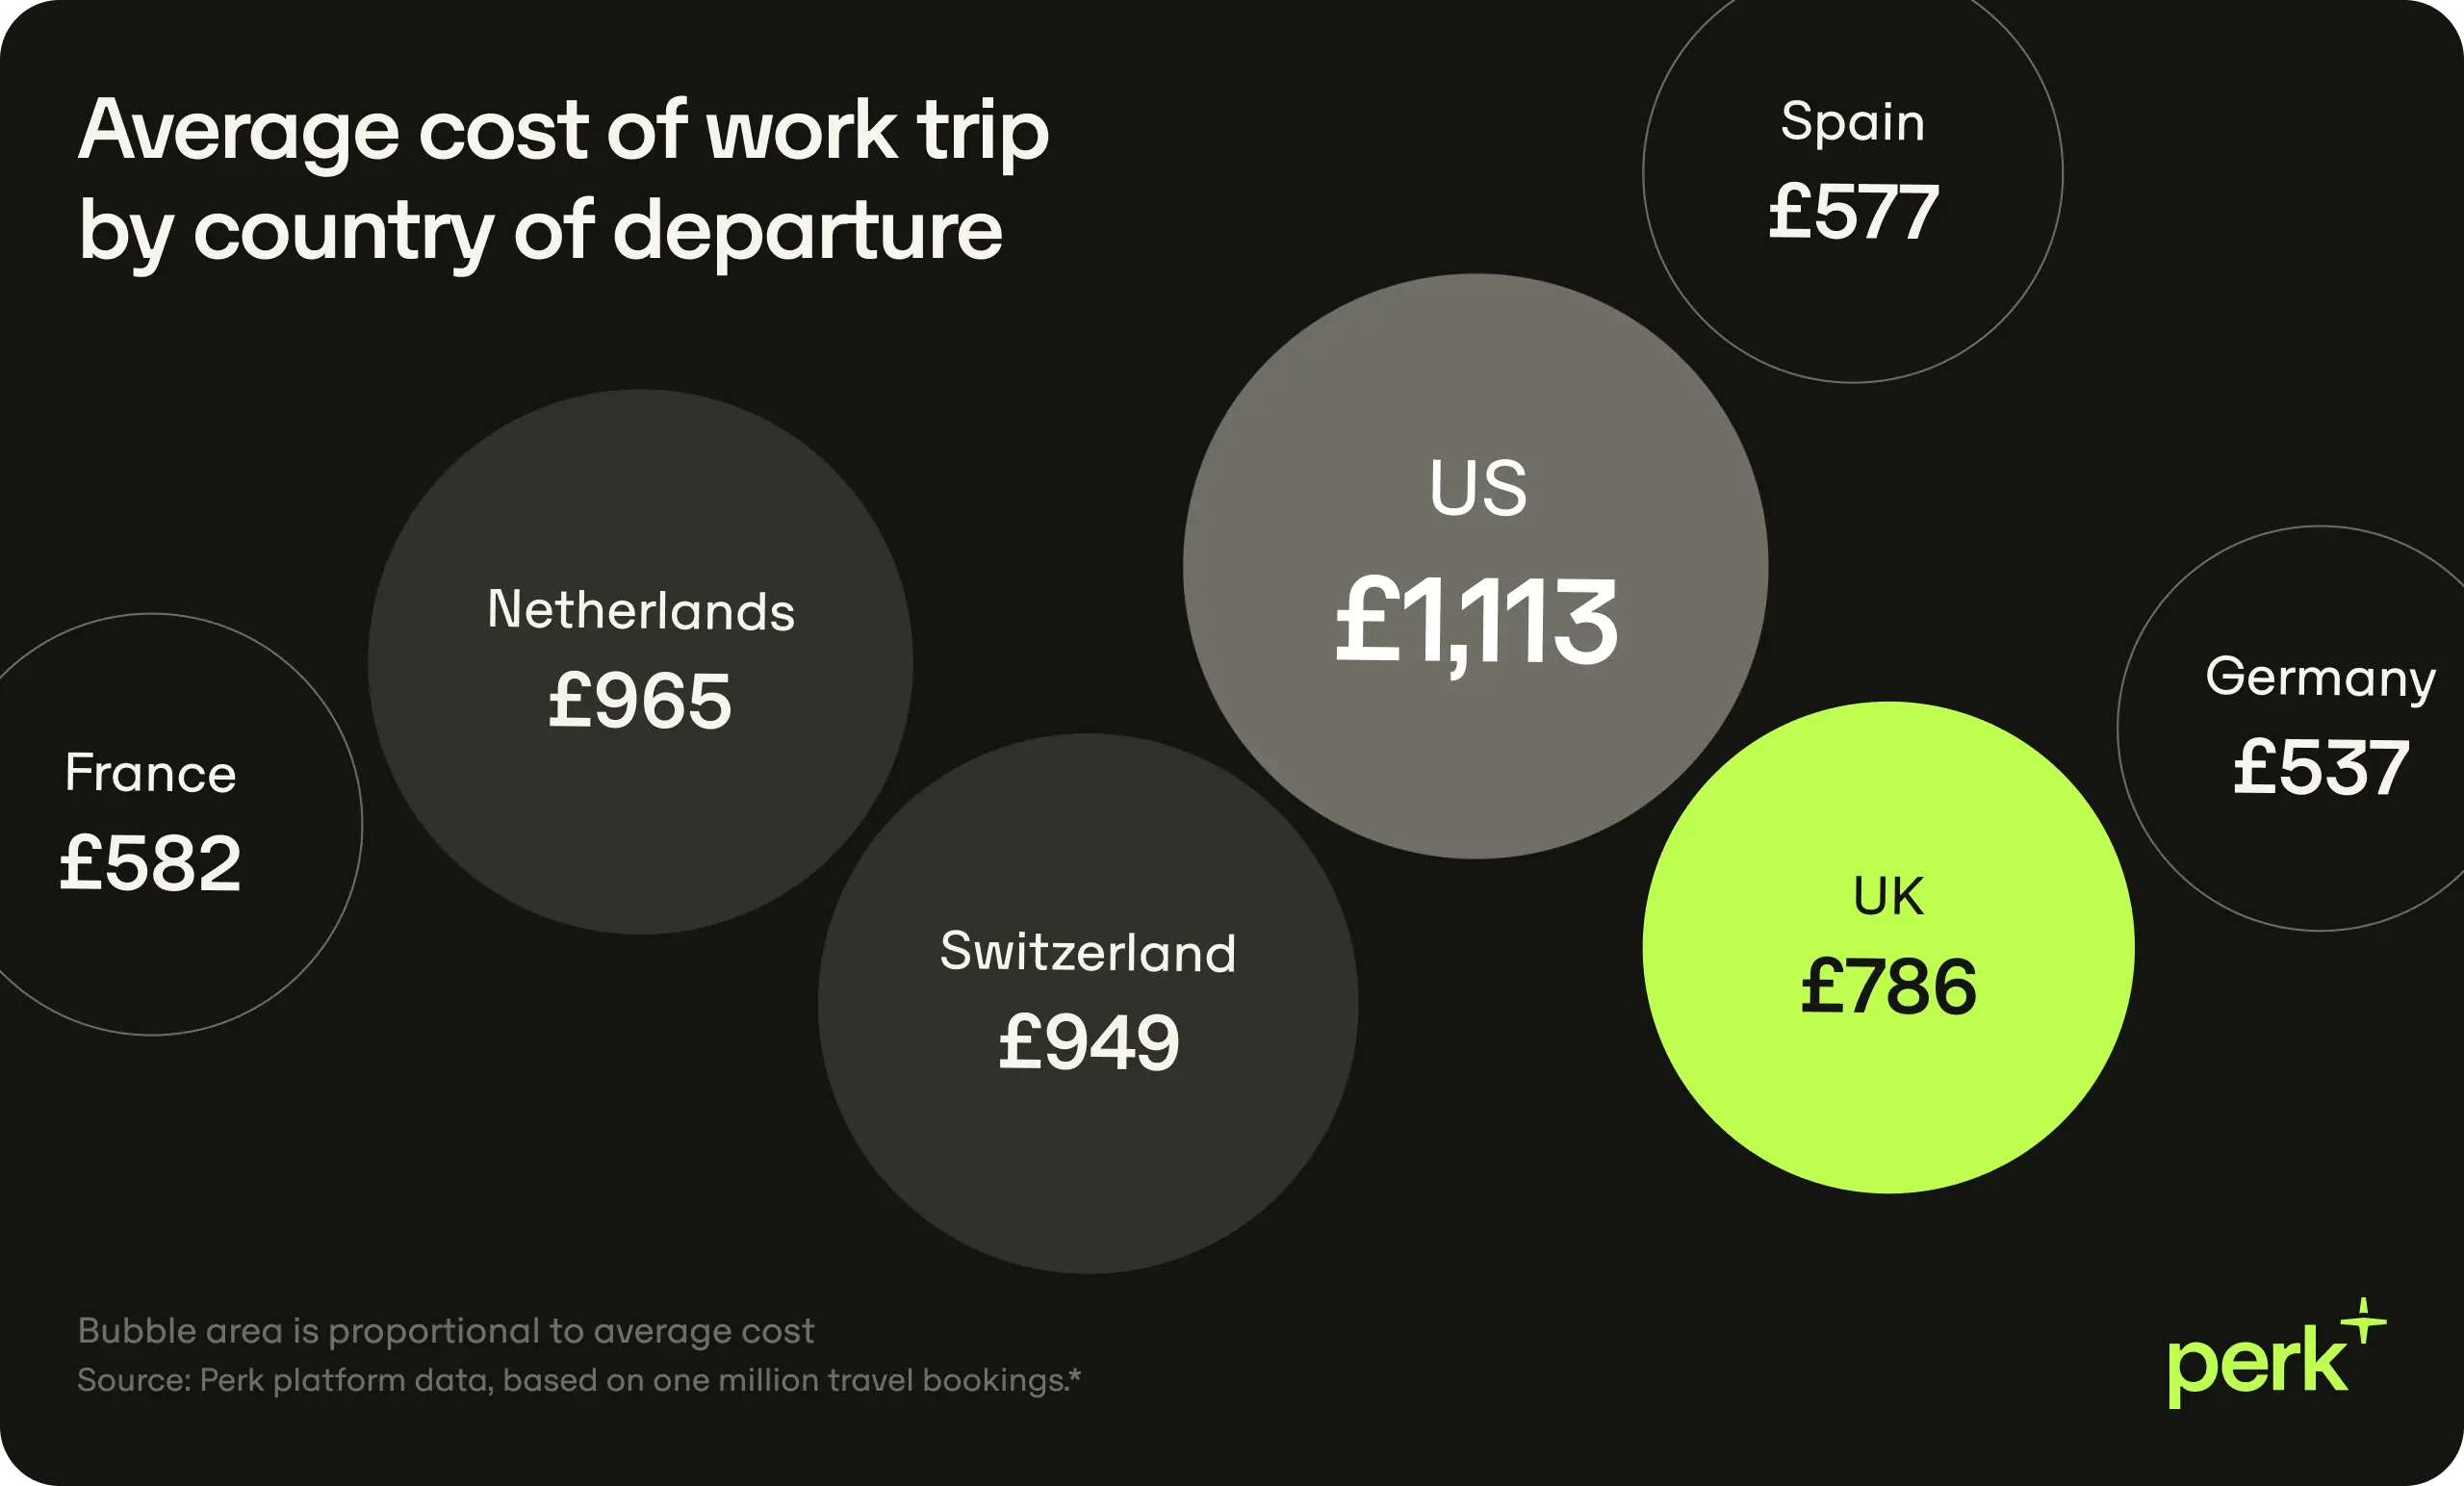
The average work trip originating in the US is more than twice the price of a trip starting from Germany. Meanwhile trips from the Netherlands or Switzerland, despite being geographically close to Germany, are closer in price to the US trips.
There are a range of local market factors that explain these differences. Different locations vary in airport taxes or the natural mix of long-haul or premium travel. Geography also influences the choice of travel mode. Most North American work trips are done by flying (82%) and only 3% use trains. The sample for Germany shows half (50%) of the trips to be by train.
But many travel policies still have only a regional budget benchmark, treating, for example, all central European markets the same. But this data really questions this approach. A policy built around a single blended European policy cap will always look reasonable in some markets but too restrictive in others: Colleagues in Germany will clear a flat cap comfortably while those in the Netherlands exceed it on almost every trip, for no other reasons than the nature of the market.
2. Hotels fill the calendar but flights fill the budget
Accessing the best deals often requires working in strong partnership with travel providers. But it can be hard to know which relationships are most critical in making your budget stretch the most.
Our analysis shows that travel booking volume and cost concentration aren’t the same thing. Hotels are the single biggest booking category in our sample by volume (42%). In the sample an average company has 18 hotel bookings a year and the average hotel booking is roughly £340.
Work travel bookings by category
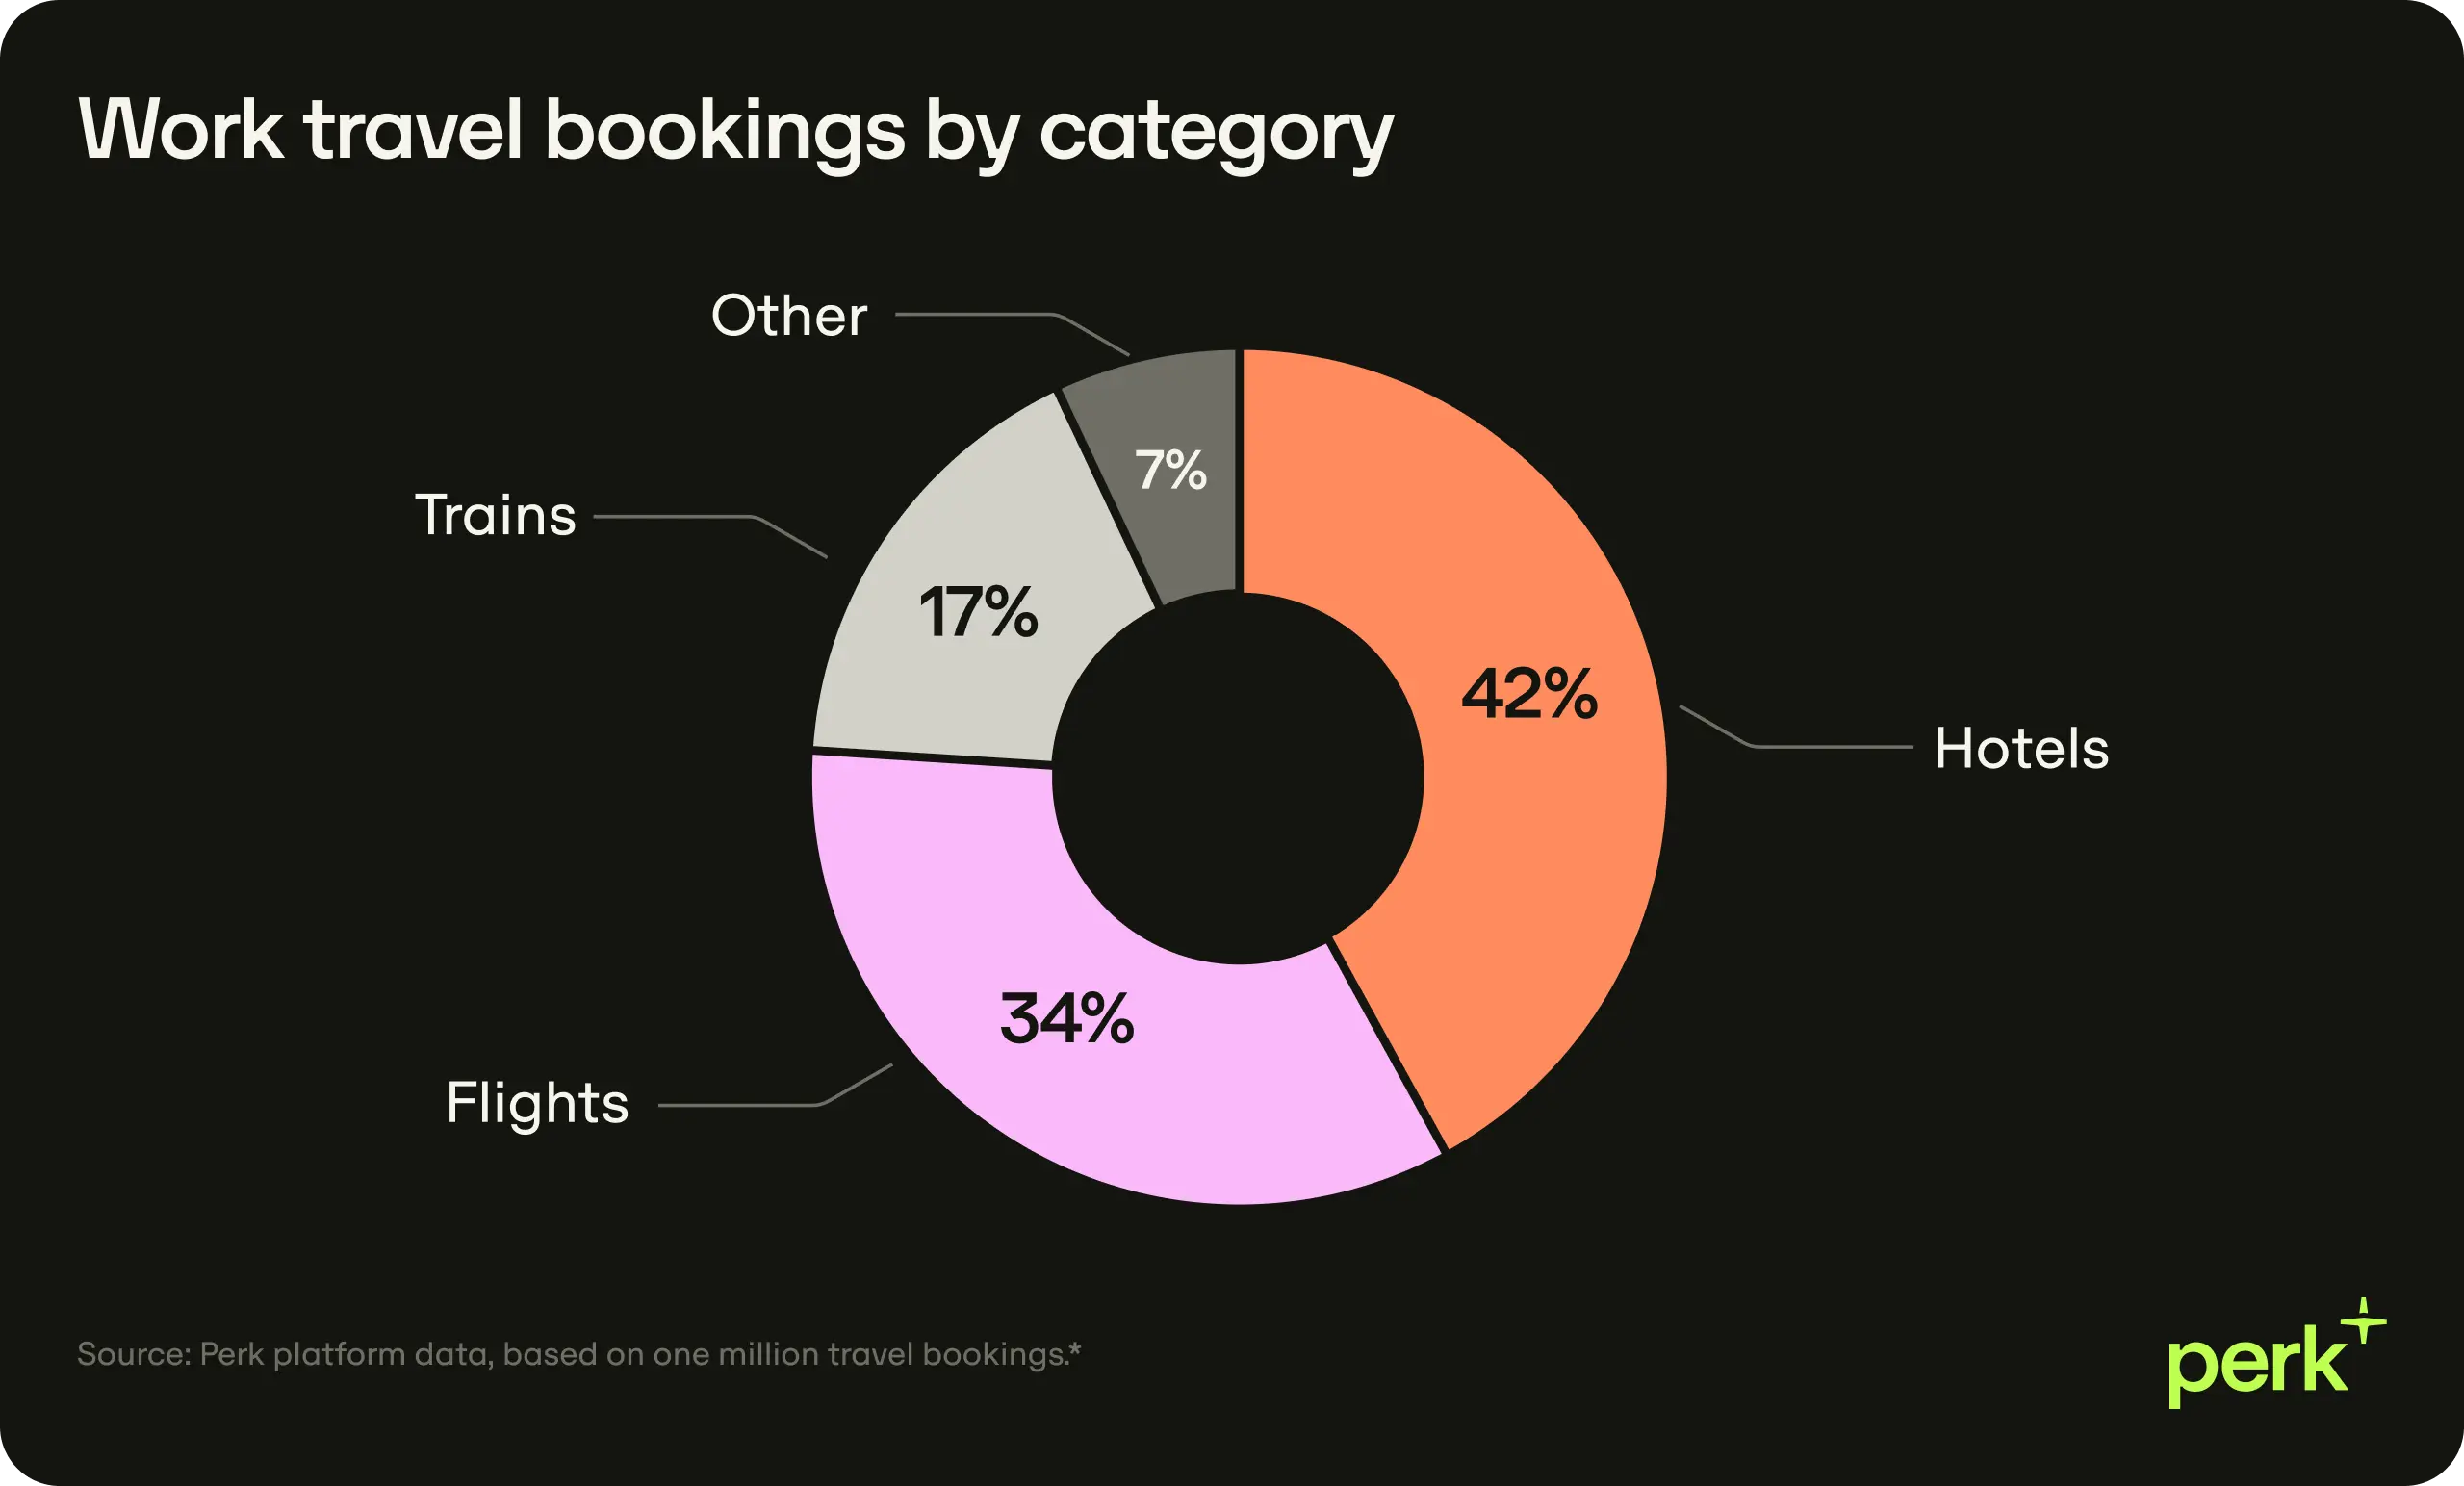
Yet, while around a third of travel bookings are flights, the average flight costs £583; 1.7x the cost of hotels. Long-haul flights make up around 24% of flight bookings but roughly 64% of flight spend.
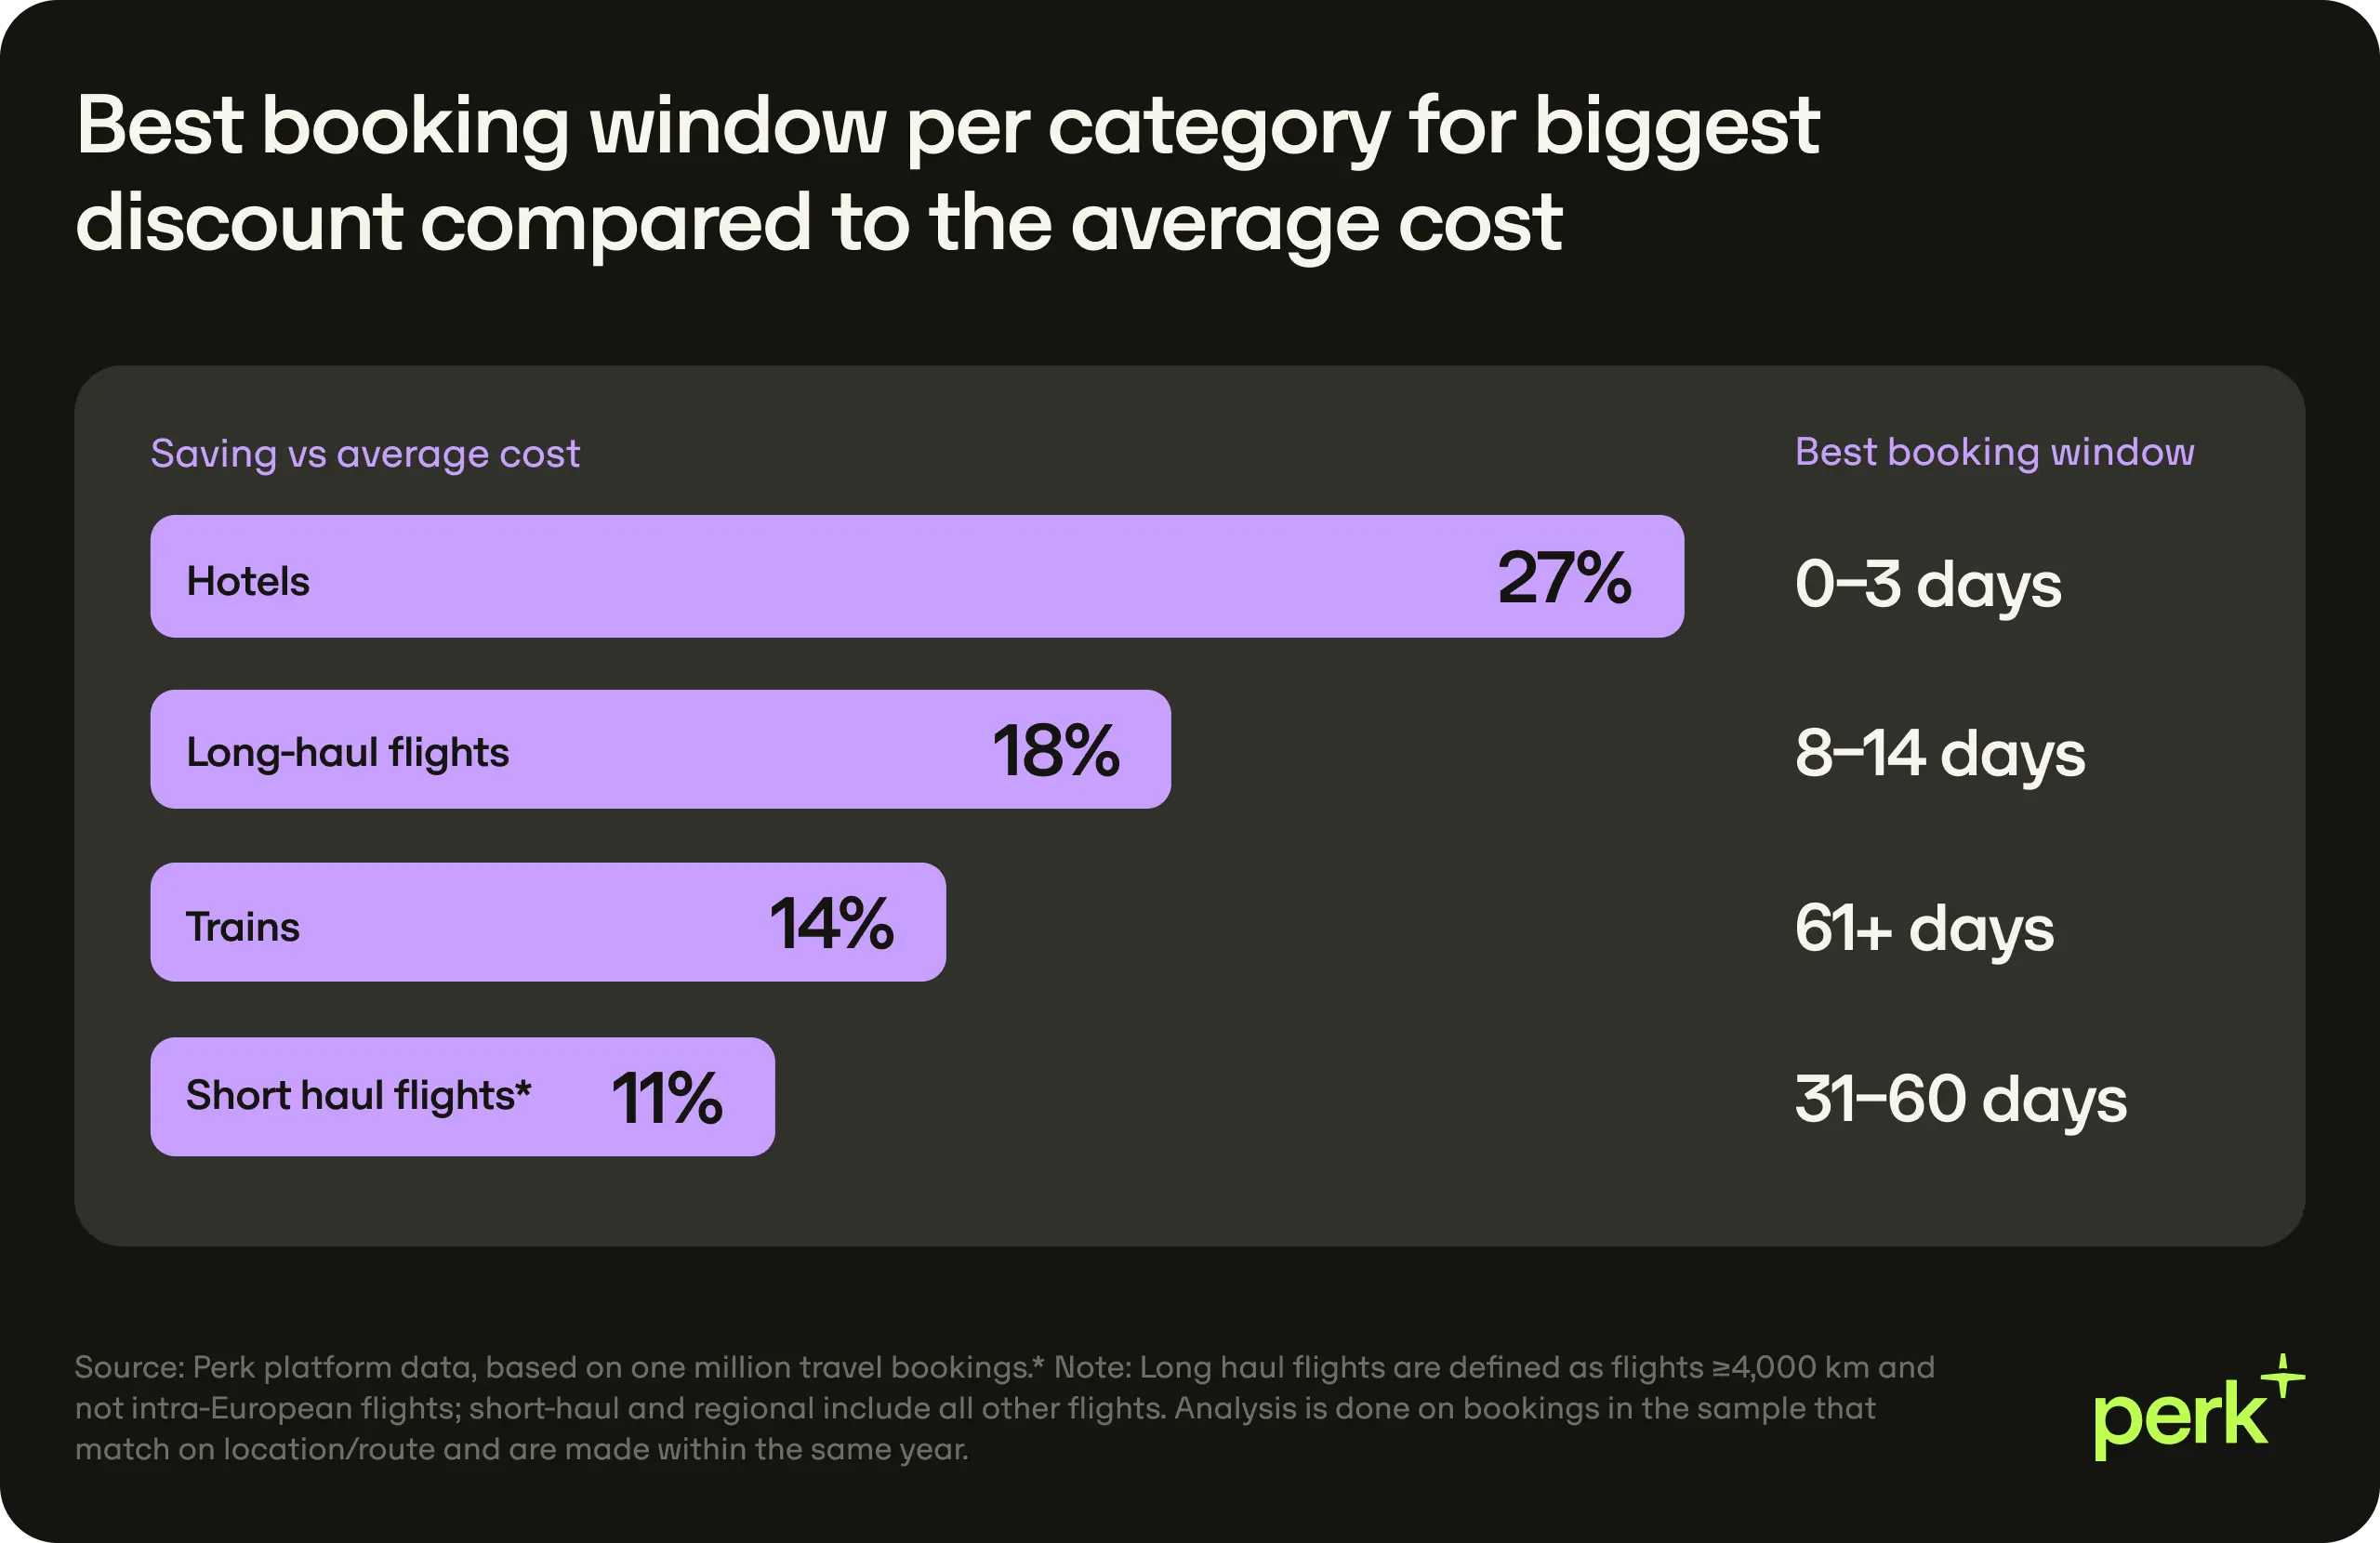
Prioritising hotel booking policies and ensuring good access to strong hotel partnerships and competitive rates is important as it impacts more bookings. Yet the biggest opportunity to get more from your budgets comes from optimising flight bookings, especially when there is frequent long-haul travel.
3. The earliest bird doesn’t always catch the best worm
Most travel policies are based on the conventional wisdom that booking early will get you the best deal. But that is not actually the case.
Booking more than a week ahead saves 3% on average — only around £8 on average per booking. Unremarkable, until you split it out: flight prices swing far more than that. Book a flight more than eight days out and it's nearly 26% cheaper than the same route booked in the final week before departure.
When layering in the full booking-window curve for flights, an even more nuanced picture appears. For long-haul flights, most bookings tend to be made more than a month ahead but this is actually the window when prices surge as demand picks up. As a result, flight prices can peak at a 4% premium above the average price for the route. The sample data suggests that long-haul flight bookings made between one to two weeks before departure actually achieve the greatest discount: 18% cheaper than the average price.
Best booking window to achieve the biggest saving compared to average cost
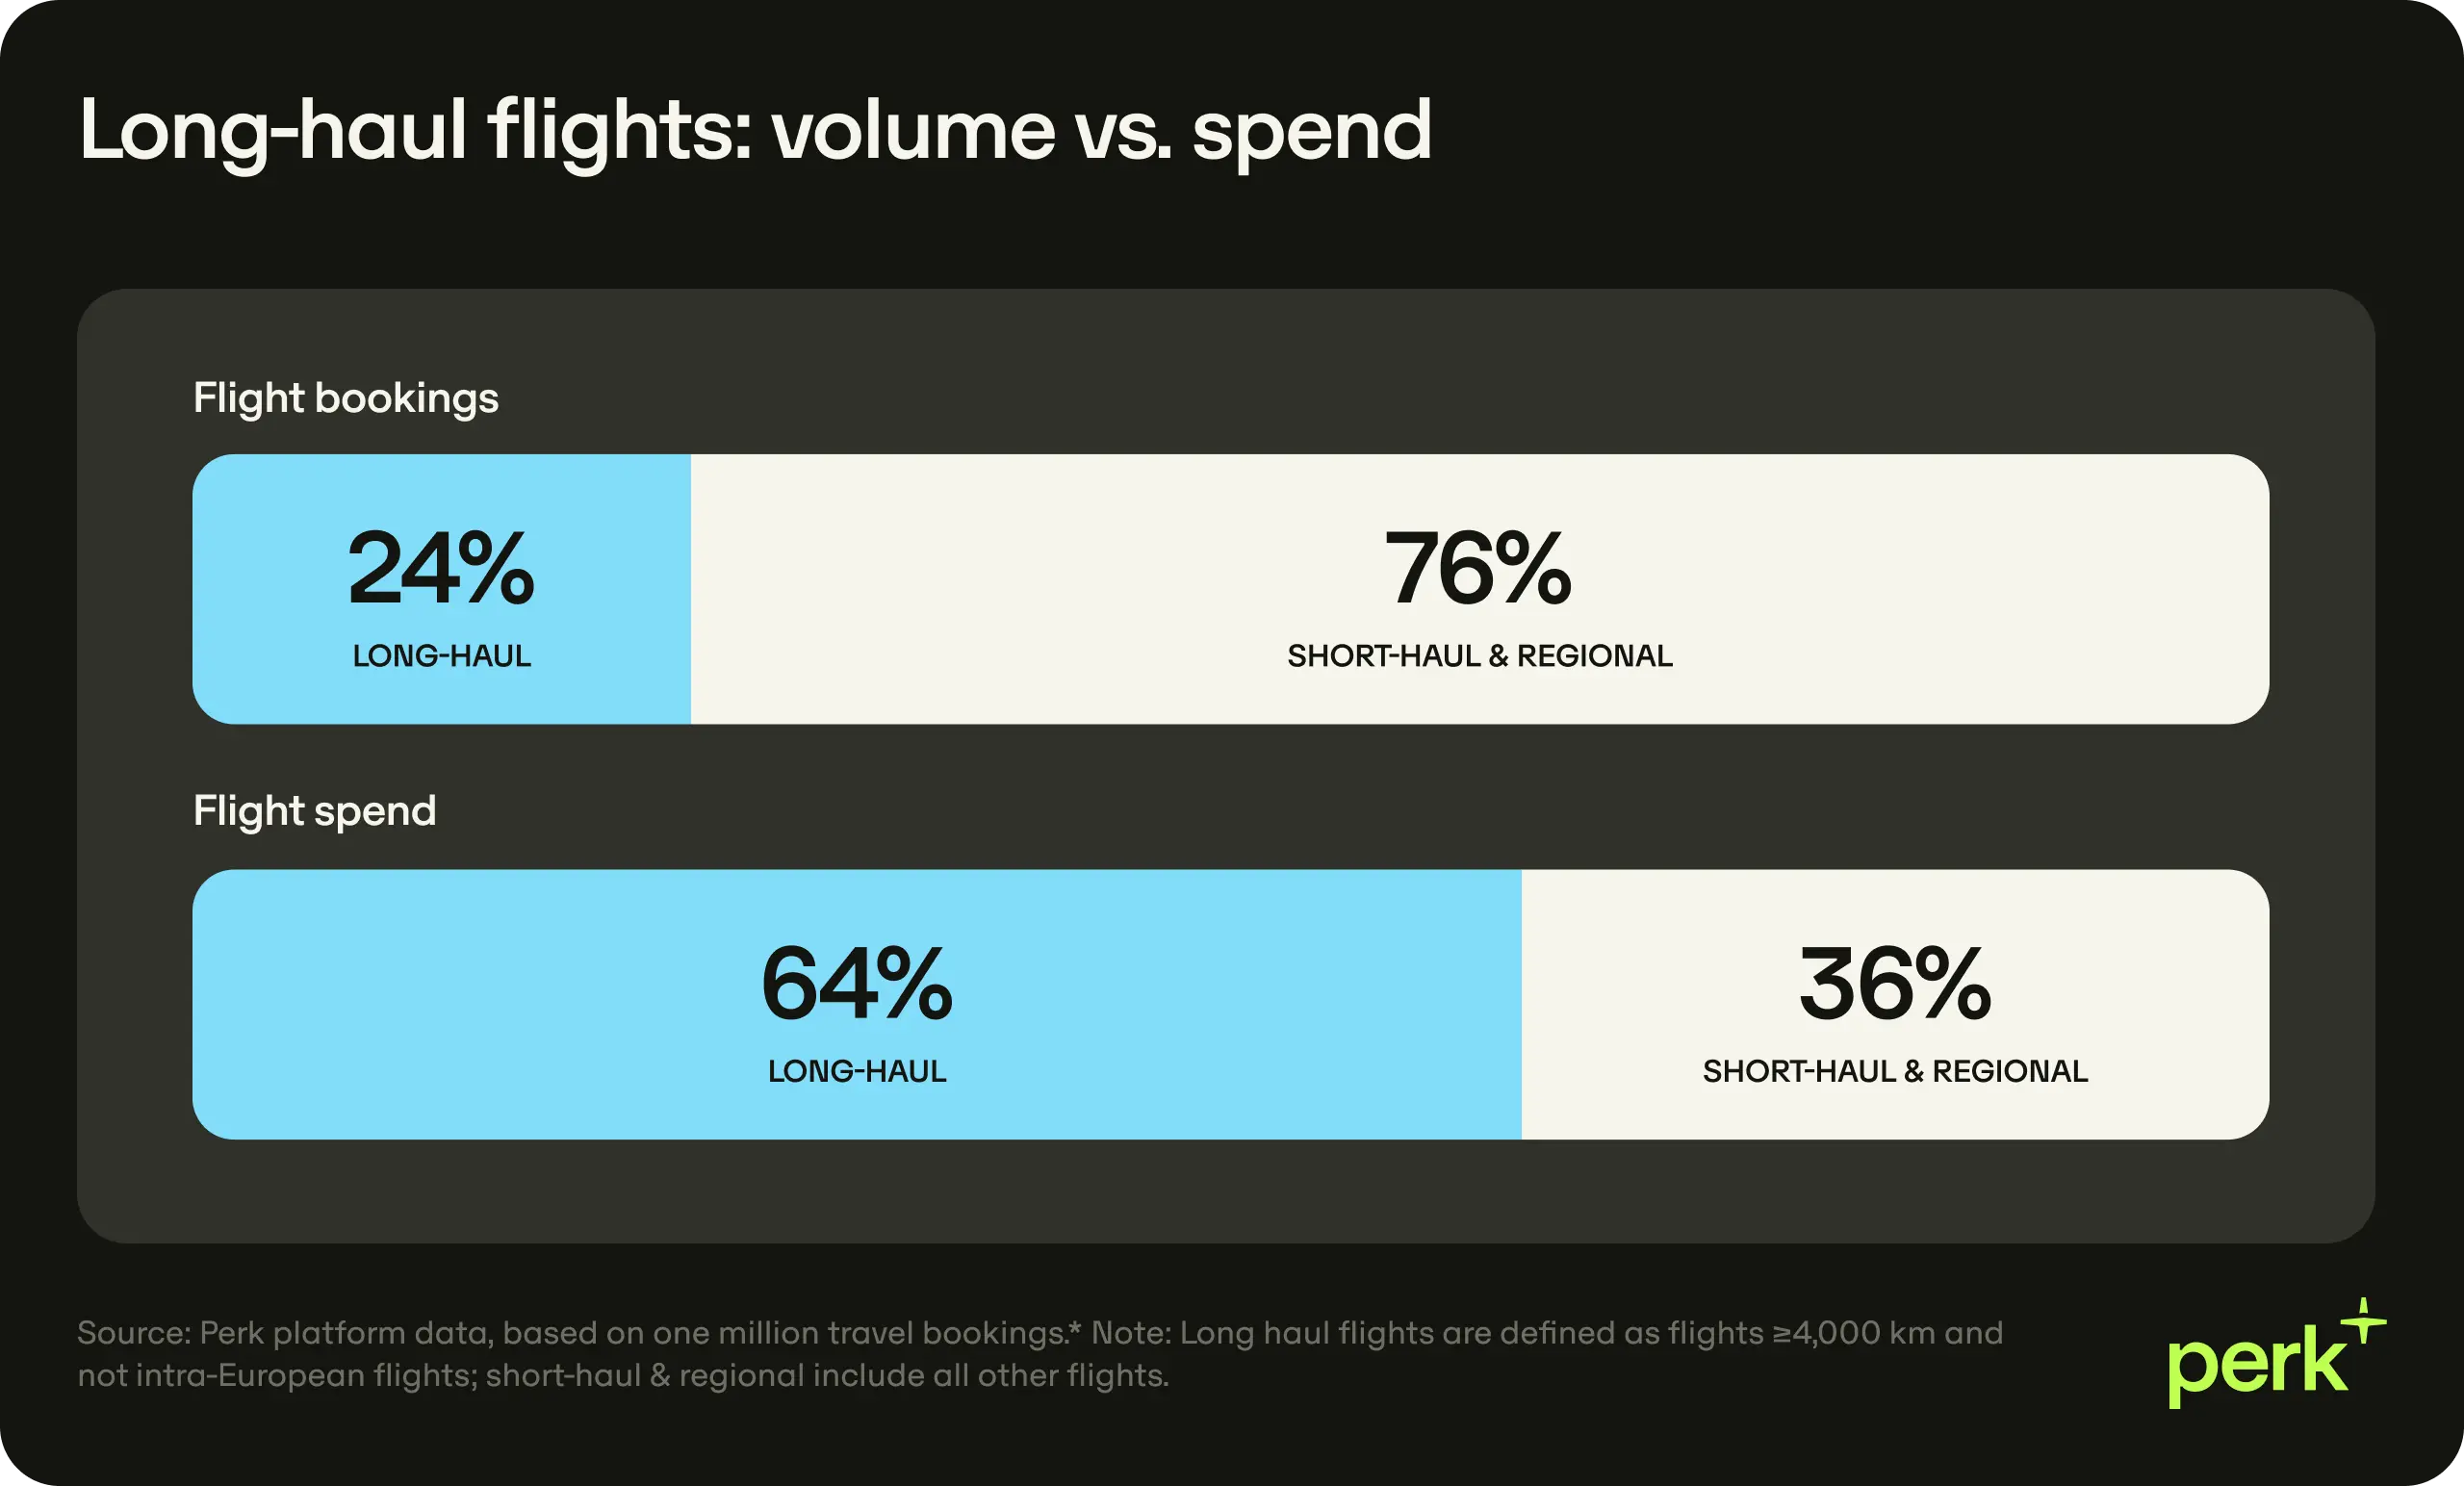
The price of shorter flights behaves differently, with the biggest discount coming 31–60 days before departure. Within this window, the flight prices are around 11% below the route average for the same year. The best deals for trains, on the other hand, are available when reserving more than 2 months ahead.
For hotels the early booking savings don’t behave quite this way. In our sample, booking a hotel more than a week ahead can actually cost more than booking it closer to the stay. These prices are more governed by demand surges and sometimes more constrained supply in a given category (for example, a 5-star hotel in a city with few such hotels).
The window for the best-value flights isn’t, therefore, a straightforward “as early as possible."
What this means for how you run the programme
Work travel is hardly ever governed by only price. You set a date for a meeting because you need to have it then, not because you can do it cheaper on that day. But that doesn’t mean that you shouldn’t try to minimise the costs.
The million bookings have shown that this is complex. There is rarely a single number to put in a travel policy that can help to manage travel costs effectively across different countries and travel categories while also minimising the effort required for approvals.
The key is to try to find ways in which the complexity can be simplified. Working with travel management companies, like Perk is a smart way because we have done the heavy lifting for you to get access to preferential deals and pricing.
Our Control Center feature uses AI to integrate your travel policy into the booking process, showing employees the approved corporate rates and what is in policy. The platform also gives the travel and finance teams access to integrated and easy-to-understand data on bookings which helps identify the main trends in your travel bookings. This is key to practical but cost effective travel management.
Check how much you could be saving on your work travel costs with Perk or speak to a Perk travel specialist.
Methodology note: This blog uses a sample of one million travel bookings made by customers on the Perk platform (formerly TravelPerk) between 29th August 2023 and 23rd August 2026. It is not based on all bookings made on the platform during this period. The sample broadly reflects Perk’s customer base and includes flight, hotel, train and car bookings. While the sample is not weighted nor controlled for any specific variables, it excludes all work travel bookings made by Perk/TravelPerk and Yokoy staff. The figures used in this blog look at bookings for complete work trips only which include a hotel plus at least one transport booking — flight, train or car. It also uses only a subset of policy-applied bookings, meaning bookings where a travel policy was attached to the booking account and could be used to classify the booking as in-policy or out-of-policy. This was the case for 95% of the bookings in the total sample. It uses a matched sample approach so that only comparable bookings are compared. For flights and trains, matching is done by origin and destination (route) and booking year. For hotels, matching is done by hotel destination and booking year but not on star rating. This controls for year-on-year price changes by comparing bookings made in the same year. The out-of-policy rate is calculated as the number of out-of-policy bookings divided by the total number of policy-applied bookings in the matched sample. The OOP premium compares out-of-policy bookings with comparable in-policy bookings in the same matched route or destination-year group, to estimate how much more expensive OOP bookings are than similar in-policy bookings. The in-policy threshold is derived from analysing the policies attached to the flight bookings in the sample. The median static threshold is calculated by using long-haul flight budget threshold, where present, or otherwise using the general flight budget or one-way flight budget threshold. It excludes policies with dynamic rules. The initial analysis was done in Euros and those amounts have been converted into GBP and USD using the average exchange rates for the period of 29th August 2023 to 23rd August 2026 which is approx. 0.85 for EUR/GBP and 1.09 for EUR/USD.
